
How I Used Azure to Analyze My Mom’s YouTube Channel👩👦📈📊
Good day everyone! This morning, I had the pleasure of waking up to a delightful conversation with my mother about her thriving YouTube channel. She expressed her curiosity and desire to understand how her previous videos have been performing, sparking a brilliant idea in my mind. Why not utilize the power of data analysis and create a comprehensive report for her? This way, she can delve into the intricacies of her channel’s dataset, enabling her to conduct valuable analysis and make informed decisions based on the insights derived. You can visit Youtube channel here 😀
So, I did the youtube analysis in Azure Machine Learning studio.
First go to your Azure portal
Search the resource “Azure Machine Learning”
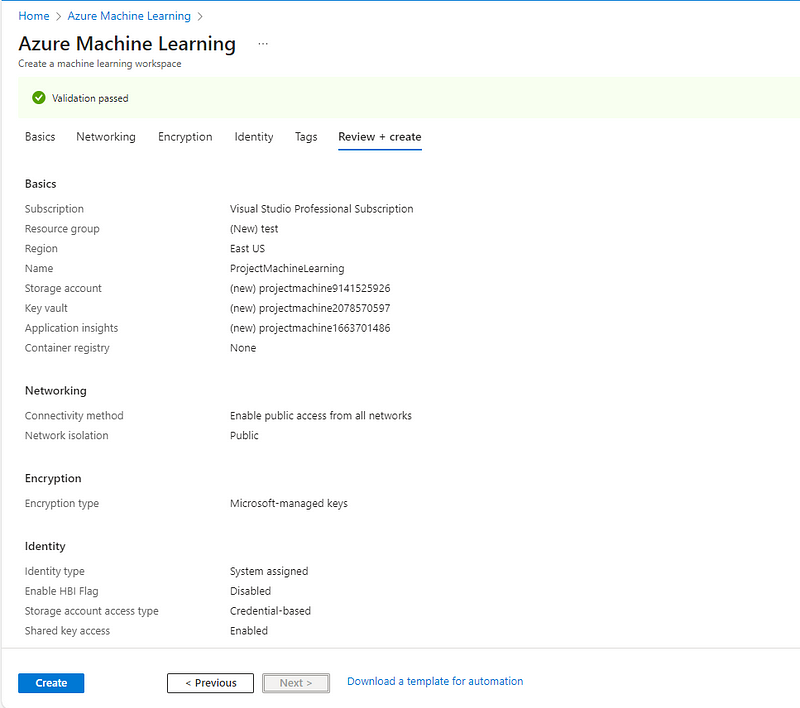
Then create the Azure Machine Learning workspace and fill the required details :
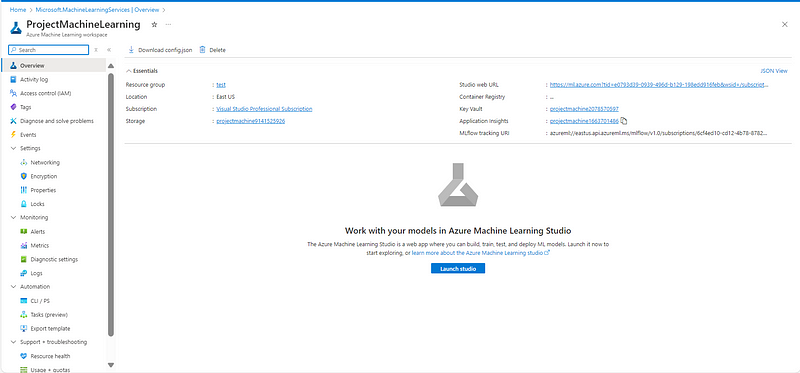
Now launch the Studio and then click on the Notebooks

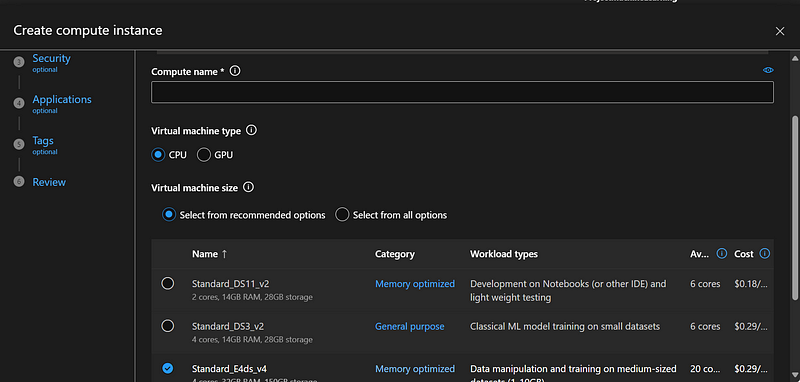
Created the file and also created the compute instances which will help to run the kernel

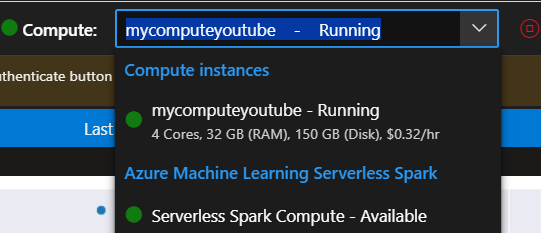
This will show like this.
Getting the Youtube API
So I collected my Mom’s youtube channel’s API Key and channel ID . To get your own youtube channel API key click here.
Then to collect Channel ID you need to go to your youtube studio and in the link you will find the channel ID present over there.
Now its time to do data analysis
Downloading the Dataset
Let’s begin by importing the required libraries
import pandas as pd
import requests
import json
api_key = 'your API Key' channel_Id = 'Your channel ID'Retrieve Data
requests.get()is retrieving data and collecting video IDs from the url using API key and channel ID.
json.loads()is reading this data in text format and saving it in ‘data’.url = f"https://www.googleapis.com/youtube/v3/channels?part=statistics&key={api_key}&id={channel_Id}" channel_info = requests.get(url) json_data1 = json.loads(channel_info.text)
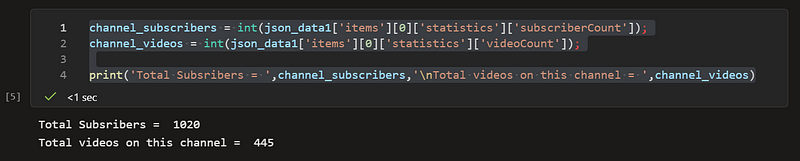
Getting Total Subscribers and Videos Count
channel_subscribers = int(json_data1['items'][0]['statistics']['subscriberCount']);
channel_videos = int(json_data1['items'][0]['statistics']['videoCount']);

print('Total Subsribers = ',channel_subscribers,'\nTotal videos on this channel = ',channel_videos)
Now I’am retrieving 15 pages of videos data and each page contains maximum 50 videos information.
limit = 15
video_Ids = []
nextPageToken ="" # used here to get page with unrepeated content, for 0th iteration let it be null
for i in range(limit):
url = f"https://www.googleapis.com/youtube/v3/search?key={api_key}&part=snippet&channelId={channel_Id}&maxResults=50&pageToken={nextPageToken}"
response = requests.get(url)
if response.status_code == 200:
data = response.json()
for item in data['items']:
if 'videoId' in item['id']:
video_Id = item['id']['videoId']
video_Ids.append(video_Id) # Storing video Ids for extracting video information
# Check if there's a nextPageToken, if not break the loop
if 'nextPageToken' in data:
nextPageToken = data['nextPageToken']
else:
break
else:
print(f"Failed to fetch data: {response.status_code}")
break
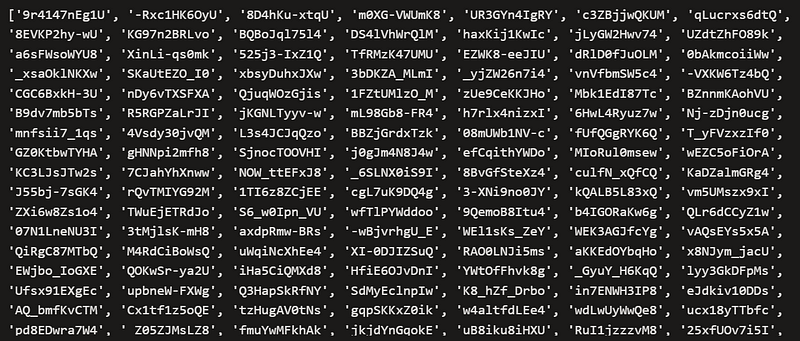
print(video_Ids)
So as result we can see its giving me all the video’s ID :
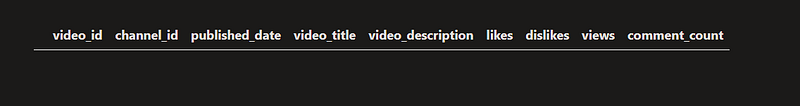
We need to retrive all the data in the categories and put it in my data framework.
data_df = pd.DataFrame(columns=['video_id','channel_id','published_date',
                             'video_title','video_description',
                             'likes','dislikes','views','comment_count'])
data_df.head()
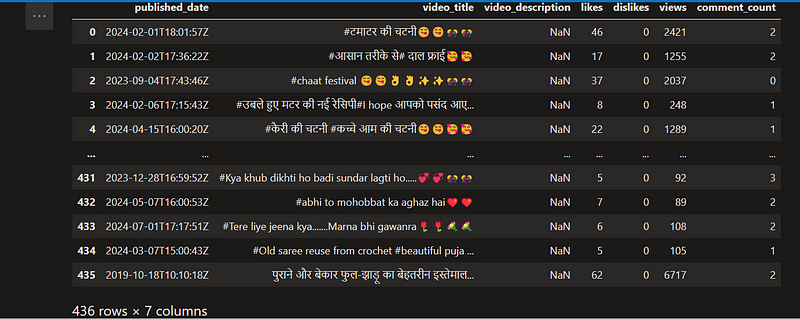
Let’s put gathered data videos in their respective categories columns
for i, video_Id in enumerate(video_Ids):
    url = f"https://www.googleapis.com/youtube/v3/videos?part=statistics,snippet&key={api_key}&id={video_Id}"
    data = json.loads(requests.get(url).text)
    if 'items' in data and len(data['items']) > 0:
        item = data['items'][0]
        channel_id = item['snippet']['channelId']
        published_date = item['snippet']['publishedAt']
        video_title = item['snippet']['title']
        video_description = item['snippet']['description']
        likes = item['statistics'].get('likeCount', '0')
        dislikes = item['statistics'].get('dislikeCount', '0')
        views = item['statistics'].get('viewCount', '0')
        comment_count = item['statistics'].get('commentCount', '0')
        row = [video_Id, channel_id, published_date, video_title, video_description, likes, dislikes, views, comment_count]
        data_df.loc[i] = row
Let’s save the collected data in csv format using below:
data_df.to_csv('AllRounderRV.csv',index=False)
Data Cleaning
We have our raw dataset. Now, we’ll remove the unwanted data, will make the dates readable and will extract the information from it (date, time, day, month year) and will store them in separate columns.
AllRounderRV_raw_df = pd.read_csv('AllRounderRV.csv')
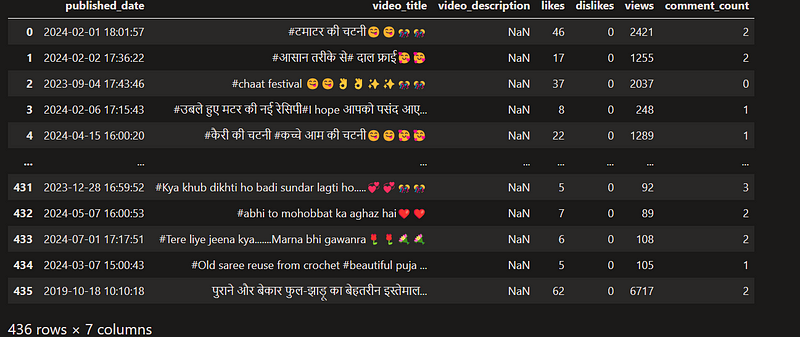
AllRounderRV_df=AllRounderRV_raw_df.drop(['channel_id','video_id'], inplace=False,axis=1)
AllRounderRV_df
Making published date and time more readable
import datetime
i=0
for i in range(AllRounderRV_raw_df.shape[0]):
    date_time_obj = datetime.datetime.strptime(AllRounderRV_df['published_date'].at[i], '%Y-%m-%dT%H:%M:%SZ')
    AllRounderRV_df['published_date'].at[i] = date_time_obj
    i = i+1
AllRounderRV_df
Separating day, month, year, date and time from the published_date column
i=0
date=[]
time=[]
year=[]
month=[]
day=[]
for i in range(AllRounderRV_df.shape[0]):
d = AllRounderRV_df['published_date'][i].date();
t = AllRounderRV_df['published_date'][i].time();
y = AllRounderRV_df['published_date'][i].date().year;
m = AllRounderRV_df['published_date'][i].date().month;
da = AllRounderRV_df['published_date'][i].date().day;
date.append(d) # Storing dates
time.append(t) # Storing time
year.append(y) # Storing years
month.append(m) # Storing months
day.append(da) # Storing days
i = i+1
AllRounderRV_df.drop(['published_date'], inplace=True,axis=1)
AllRounderRV_df['published_date']=date
AllRounderRV_df['published_time']=time
AllRounderRV_df['year']=year
AllRounderRV_df['month'] = month
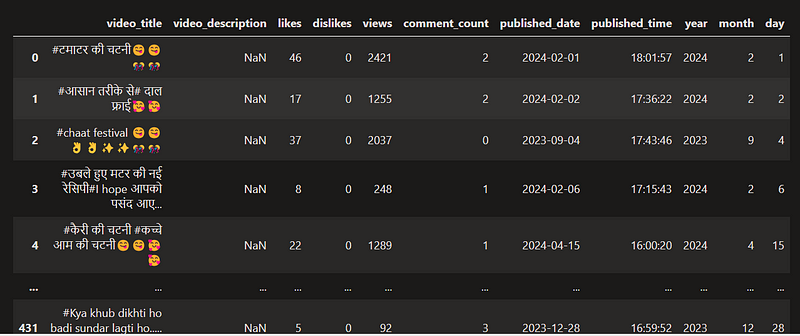
AllRounderRV_df['day'] = day
AllRounderRV_df
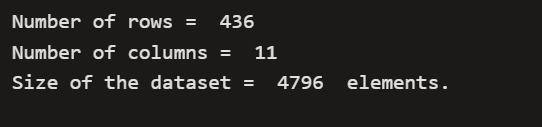
Size of dataset
print('Number of rows = ',AllRounderRV_df.shape[0],'\nNumber of columns = ',AllRounderRV_df.shape[1],'\nSize of the dataset = ',AllRounderRV_df.size,' elements.')
Data Visualization
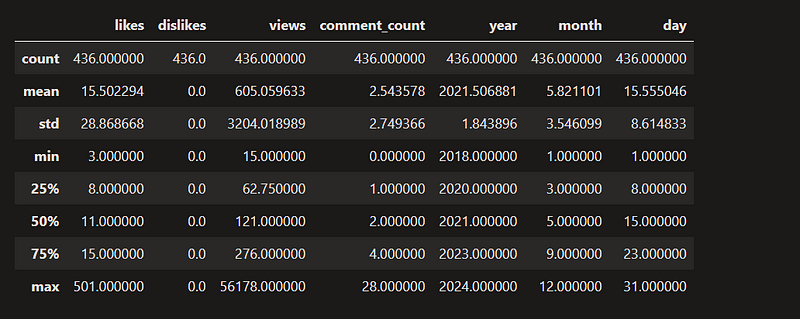
In this section, we’ll calculate interesting parameters like sum, mean, standard deviation, range of values etc and then will see different relationships among channel statistics parameters ( views, likes, comments, dislikes etc).
AllRounderRV_df.describe()
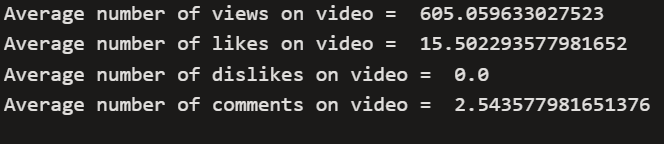
Total views, likes, dislikes and comments of all videos
AllRounderRV_df[['views','likes','dislikes','comment_count']].sum()AvgLikes = AllRounderRV_df.describe()['likes']['mean'] AvgDislikes = AllRounderRV_df.describe()['dislikes']['mean'] AvgViews = AllRounderRV_df.describe()['views']['mean'] AvgComments = AllRounderRV_df.describe()['comment_count']['mean'] print('Average number of views on video = ',AvgViews,'\nAverage number of likes on video = ',AvgLikes,'\nAverage number of dislikes on video = ',AvgDislikes,'\nAverage number of comments on video = ',AvgComments,'\n')
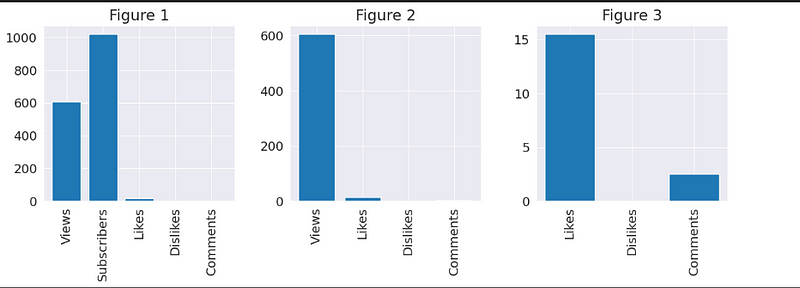
Graph Visualization
import seaborn as sns
import matplotlib
import matplotlib.pyplot as plt
%matplotlib inline

sns.set_style('darkgrid')
matplotlib.rcParams['font.size'] = 14
matplotlib.rcParams['figure.figsize'] = (12, 5)
matplotlib.rcParams['figure.facecolor'] = '#00000000'
fig = plt.figure() ax1 = fig.add_axes([0, 0, 0.75, 0.75], aspect=1) # add_axes([left, bottom, width, height],aspect=1) # Viewers who react on videos pie_vars = ['Reacters','Neutral']; pie_values = [AllRounderRV_df['likes'].sum()+AllRounderRV_df['dislikes'].sum(),AllRounderRV_df['views'].sum()-(AllRounderRV_df['likes'].sum()+AllRounderRV_df['dislikes'].sum())] ax1.pie(pie_values,labels=pie_vars,autopct='%1.2f%%'); ax1.set_title('Viewers who react on video') ax2 = fig.add_axes([0.8, 0, 0.75, 0.75], aspect=1) # Pie chart of reacters pie_vars = ['Likers','Dislikers','Commenters']; pie_values = [AllRounderRV_df['likes'].sum(),AllRounderRV_df['dislikes'].sum(),AllRounderRV_df['comment_count'].sum()] ax2.pie(pie_values,labels=pie_vars,autopct='%1.2f%%'); ax2.set_title('Type of reacters') ax3= fig.add_axes([0.4, -0.75, 0.75, 0.75], aspect=1) # Pie chart of commenters vs non commenters with respect to total viewers pie_vars = ['Comments','Non-Commenters']; pie_values = [AllRounderRV_df['comment_count'].sum(),AllRounderRV_df['views'].sum()-AllRounderRV_df['comment_count'].sum()] ax3.pie(pie_values,labels=pie_vars,autopct='%1.2f%%'); ax3.set_title('Viewers vs total comments') plt.show()

# Histogram of number of subscribers vs avg. viewers vs avg. likers vs avg. dislikers vs avg. commenters
fig, (ax1, ax2, ax3) = plt.subplots(1, 3)
bar_vars = ['Views','Subscribers','Likes','Dislikes','Comments'];
bar_values = [AllRounderRV_df.describe()['views']['mean'],channel_subscribers,AllRounderRV_df.describe()['likes']['mean'],AllRounderRV_df.describe()['dislikes']['mean'],AllRounderRV_df.describe()['comment_count']['mean']]
ax1.bar(bar_vars,bar_values);
ax1.set_xticks(bar_vars)
ax1.set_xticklabels(bar_vars,rotation=90)
ax1.set_title('Figure 1')

bar_vars = ['Views','Likes','Dislikes','Comments'];
bar_values = [AllRounderRV_df.describe()['views']['mean'],AllRounderRV_df.describe()['likes']['mean'],AllRounderRV_df.describe()['dislikes']['mean'],AllRounderRV_df.describe()['comment_count']['mean']]
ax2.bar(bar_vars,bar_values);
ax2.set_xticks(bar_vars)
ax2.set_xticklabels(bar_vars,rotation=90)
ax2.set_title('Figure 2')

bar_vars = ['Likes','Dislikes','Comments'];
bar_values = [AllRounderRV_df.describe()['likes']['mean'],AllRounderRV_df.describe()['dislikes']['mean'],AllRounderRV_df.describe()['comment_count']['mean']]
ax3.bar(bar_vars,bar_values);
ax3.set_xticks(bar_vars)
ax3.set_xticklabels(bar_vars,rotation=90)
ax3.set_title('Figure 3')
plt.tight_layout(pad=2)
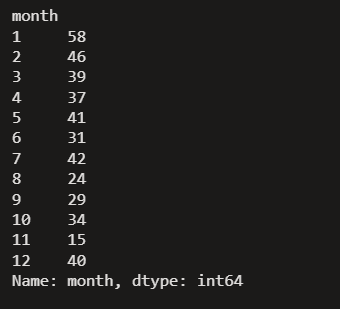
Monthwise uploaded videos
AllRounderRV_df.groupby('month')['month'].count()
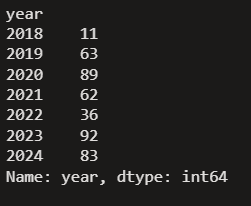
Yearwise uploaded videos
AllRounderRV_df.groupby('year')['year'].count()
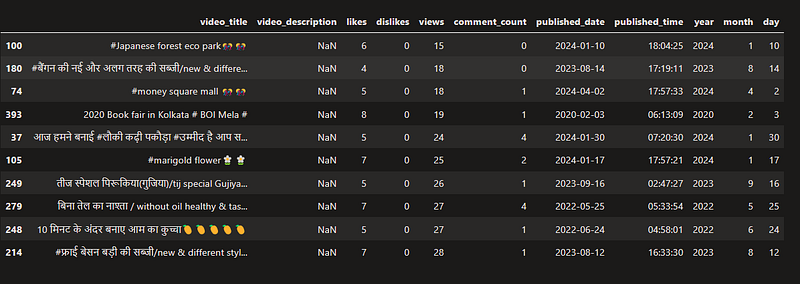
Top 10 least viewed videos from the dataset
AllRounderRV_df.sort_values(by='views',ascending=True).head(10)
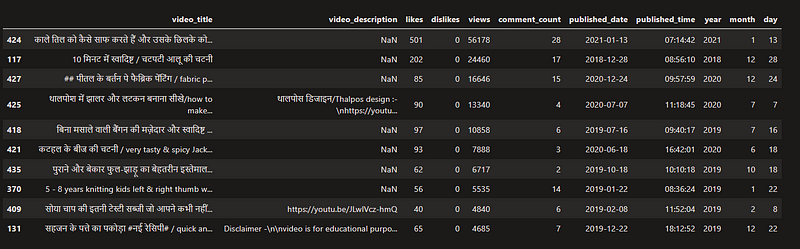
Top 10 most viewed videos from the dataset
pd.options.display.max_colwidth = 50
AllRounderRV_df.sort_values(by='views',ascending=False).head(10)
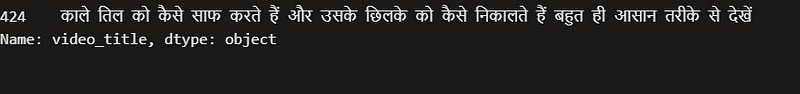
Most famous Video
pd.options.display.max_colwidth = 100
print(AllRounderRV_df.sort_values(by='views',ascending=False).head(1)['video_title'])
Top Comments video
pd.options.display.max_colwidth = 100
AllRounderRV_df.sort_values(by='comment_count',ascending=False).head(1)

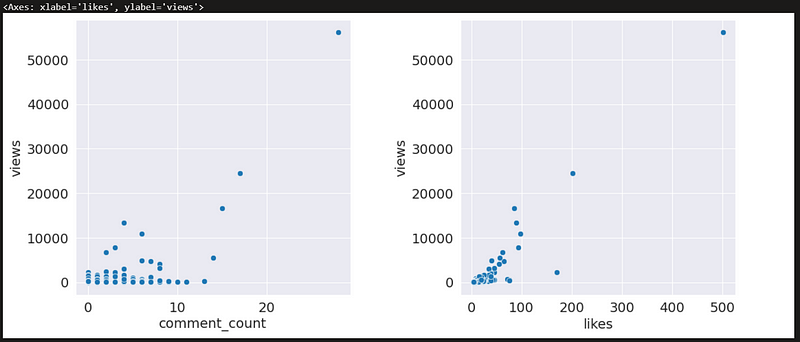
Scatterplot graph on likes and comment_count as per views
fig,ax=plt.subplots(1,2)
plt.subplots_adjust(left=0.1,
bottom=0.1,
right=0.9,
top=0.9,
wspace=0.4,
hspace=0.4)
sns.scatterplot(data=AllRounderRV_df,x="comment_count",y="views",ax=ax[0])
sns.scatterplot(data=AllRounderRV_df,x="likes",y="views",ax=ax[1])
Thanks for stopping by! Your visit means a lot. Please Follow me😊 Stay tuned for more content. Exciting stuff coming your way soon! 🚀 #StayTuned.Also, visit on RioTech.


Post Comment
You must be logged in to post a comment.